The 2026 Advantage: Why A/B Testing Is a Game Changer for Event Marketing
Data Over Gut – Embracing a Testing Mindset
Event marketers in 2026 face intense competition for attention. The old days of relying on gut feelings or one-size-fits-all promotions are over. Winning campaigns now leverage data and experimentation over hunches. Top promoters treat every campaign element as a hypothesis to test, from ad visuals to email wording. This mindset shift reflects 2026’s major event marketing trend toward data-driven strategy, where decisions are guided by metrics instead of guesswork. Experienced organizers have learned that if you “don’t know what works until you test it,” you risk wasting budget on the wrong tactics.
Keeping up with A/B testing news in 2026 is essential for promoters who want to maintain a competitive edge. For instance, algorithm updates and platform changes rolled out in January 2026 have shifted how digital ad platforms handle automated split testing. Staying informed on the latest experimentation features ensures your marketing team isn’t relying on outdated methodologies when launching campaigns.
Following the latest A/B testing news today in 2026 means staying alert to continuous platform evolutions. As ad networks increasingly rely on AI-driven delivery, promoters must adapt their split-testing frameworks to account for machine learning phases, ensuring that new algorithmic updates don’t skew their baseline data.
Adapting in a Privacy-First Landscape
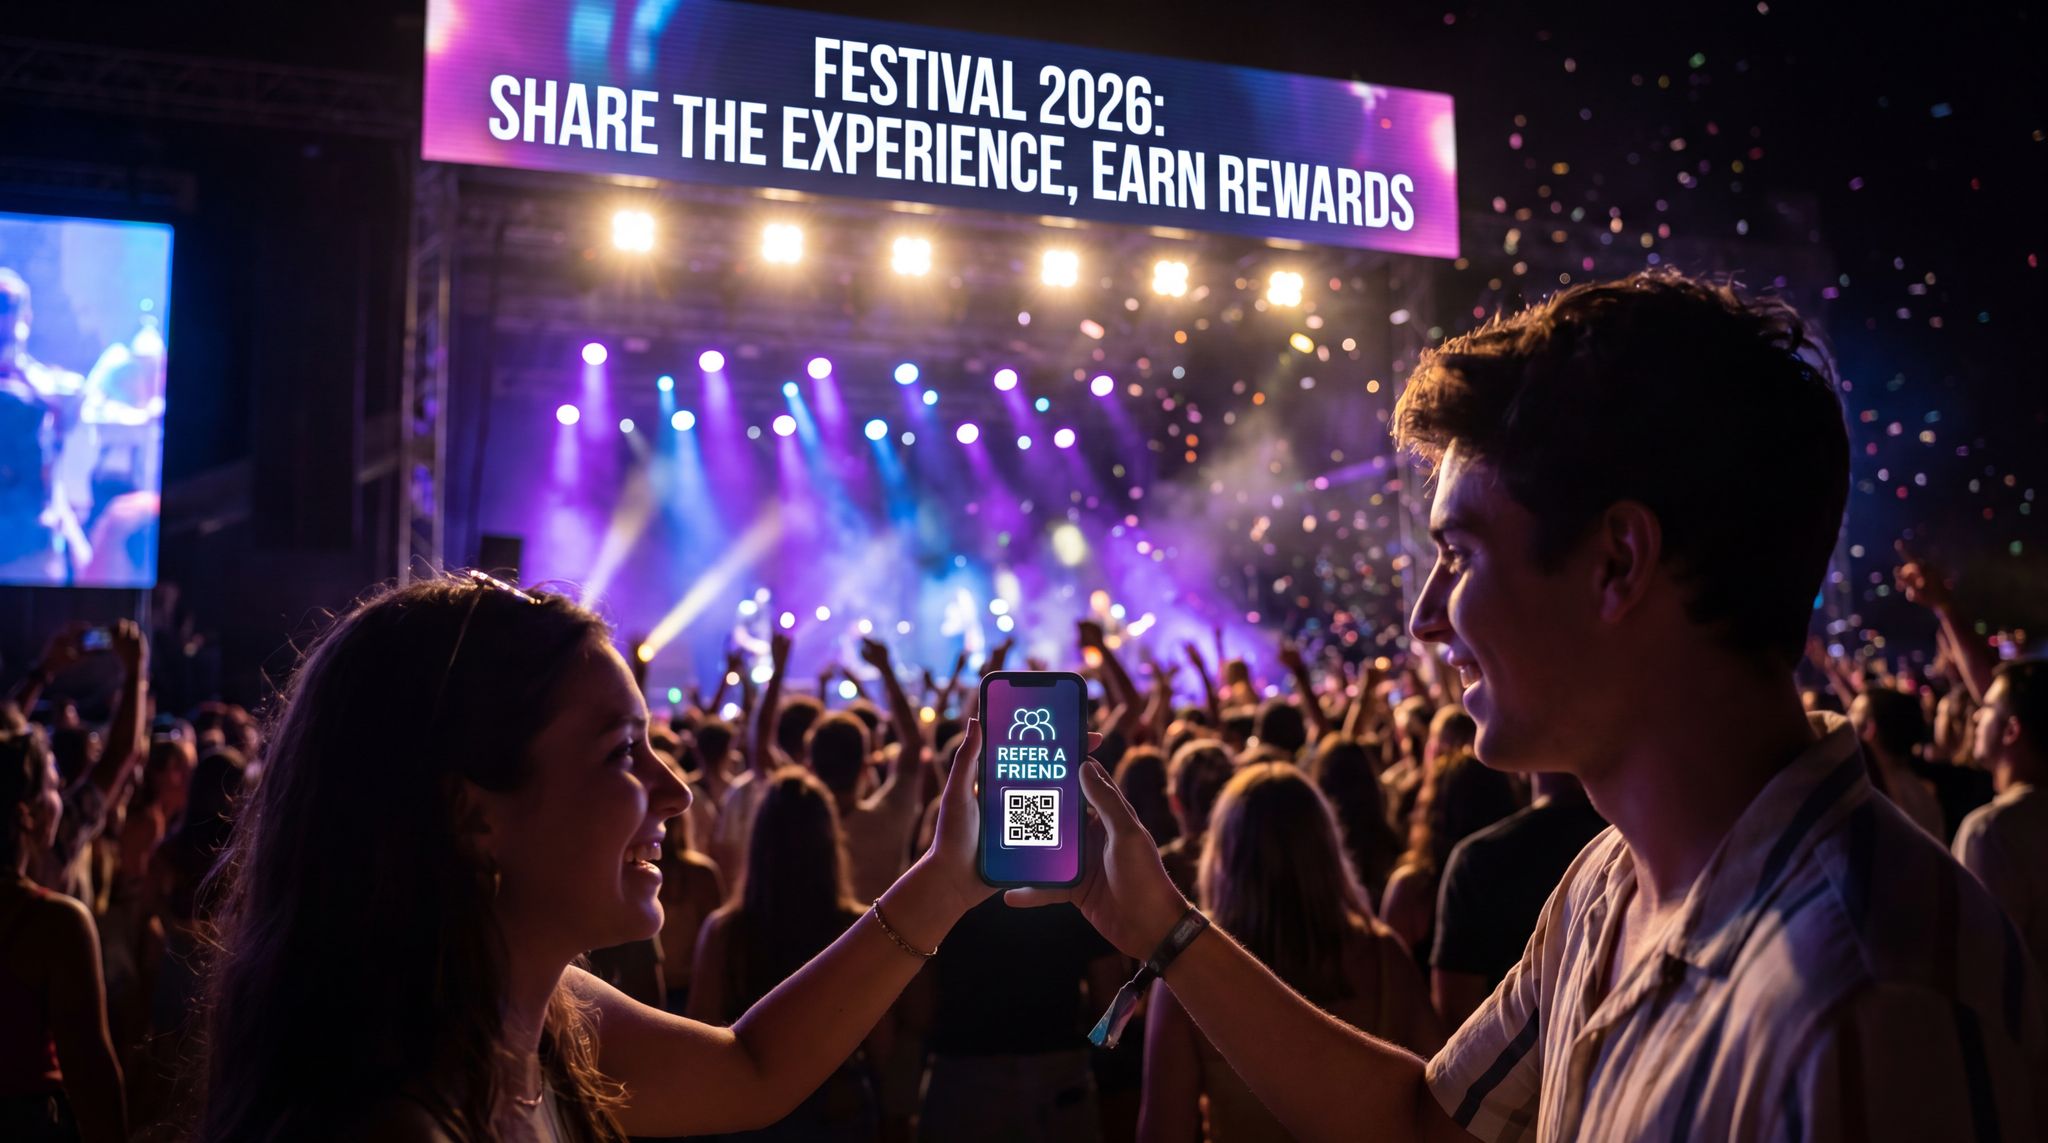
Consumer privacy changes (like iOS updates and cookie loss) make targeting less precise, but A/B testing provides a solution. When detailed personal targeting is harder, testing different creatives and messages helps you find what resonates with broad audiences. For example, if you can’t perfectly target 25–34 year-old festival-goers anymore, you can still experiment with two ad versions – one highlighting the lineup, another highlighting the experience – to see which draws more clicks. By measuring results with first-party data and flexible attribution methods, event marketers can thrive even as tracking gets tougher. Staying on top of measuring event marketing success without third-party cookies is crucial to interpret your A/B test outcomes. The key is adapting: when algorithms give less insight, let audience behavior in your tests guide your next move.
Data-Driven Event Marketing
Track ticket sales, demographics, marketing ROI, and social reach in real time. Exportable reports give you the insights to make smarter decisions.
Continuous Optimization in a Crowded Market
Live events are back in full force, and every promoter is fighting for ticket buyers. The only way to stand out is through continuous optimization. That means never settling on your first marketing idea – instead, iterate constantly. If an early ad isn’t performing, you launch a variant with a new angle. If last week’s email subject line underperformed, you try a different style this week. Trends shift and audience tastes evolve rapidly (today’s winning hook can become tomorrow’s white noise), so ongoing A/B testing ensures you stay ahead of the curve. Consistent testing = growth, while complacency can leave your event lost in the shuffle. Savvy teams plan campaigns with built-in experiment cycles, learning and improving at each step. In a crowded market, this agility can make the difference between a half-full venue and a sell-out show.
Small Changes, Big Results: Proof That Testing Works
One of the most empowering aspects of A/B testing is how tiny tweaks can yield major gains. We’ve seen this firsthand in event marketing. For example, Denmark’s Aarhus Teater boosted online ticket revenue by 20% with a one-word change in their call-to-action button – switching “Buy Ticket” to “Buy Tickets” signaled buyers could purchase for friends, dramatically increasing conversions, as detailed in a LinkedIn case study on CTA optimization. In another case, a festival’s email campaign tested two subject lines: “Don’t Miss Out – 50% of Tickets Gone!” vs. “Join Us for an Unforgettable Experience.” The urgency-focused subject line delivered a 30% higher open rate and doubled the ticket sales from that email compared to the generic messaging. These real-world wins underline a powerful lesson: data-driven tweaks trump assumptions. You might think an elaborate design or witty copy is best, but the numbers often tell a different story. Even if you’re an experienced promoter, A/B tests will surprise you – and those surprises lead to more tickets sold.
Ready to Sell Tickets?
Create professional event pages with built-in payment processing, marketing tools, and real-time analytics.
Quick Stat: A/B testing isn’t a niche practice – it’s now mainstream. Over 90% of companies actively A/B test their email campaigns, as reported by Predictive Response, and studies show it’s the #1 method marketers use for conversion optimization, based on conversion rate optimization statistics from TrueList. If you’re not testing, you’re leaving insights (and ticket sales) on the table.
A/B Testing Fundamentals: Setting Up Experiments that Deliver
Define Clear Goals & Hypotheses
Every successful A/B test starts with a specific goal and hypothesis. Before launching any experiment, pinpoint what you’re trying to improve (email open rate, ad click-through rate, ticket purchase conversion, etc.) and form a hypothesis around it. For example, you might hypothesize “Adding a headline about ‘limited tickets’ on our landing page will increase ticket purchases by creating urgency.” This clarity is crucial – it focuses your test on a measurable outcome. Experienced event marketers set SMART goals (e.g. “increase landing page conversion from 4% to 6%”) and design each test to learn something actionable. Defining the question you want answered (“Will an artist photo banner drive more interest than a venue photo?”) will ensure your A/B test yields insights, not just data. Know your success metric upfront too – whether it’s click rate, conversion rate, or ROI, decide how you’ll judge winner vs. loser. This goal-oriented approach stops random testing and instead ties experiments to business outcomes (like more tickets sold or lower cost per acquisition). When your hypothesis is clear, everyone from your team to sponsors understands why you’re testing and what a “win” looks like.
Isolate One Variable at a Time
To confidently credit a performance change to a specific tweak, you must test one element at a time. If Version A and Version B of your ad differ in both image and caption text, and B performs better, you won’t know which change made the impact. Was it the image or the copy? This is a classic rookie mistake in A/B testing – changing too many variables at once muddy the waters. Instead, follow the isolation principle: pick a single variable (headline text, background color, ticket pricing display, etc.) and create two versions identical in every other way. That way, any difference in results can be attributed to that one change. For instance, if you want to improve your event flyer’s effectiveness, test headline A vs. headline B while keeping the design and details constant. Or in an email, test including the recipient’s first name in the subject vs. not – but keep the rest of the email identical. It may feel slow to test one tweak at a time, but this discipline is how you get scientifically valid answers. Experienced campaign veterans know that multivariate tests (changing several things) require much larger traffic and complex analysis – not ideal for most events. Stick to simple split tests so you can confidently proclaim “Changing X to Y increased our click-through rate by 2%,” without caveats. It’s better to do a series of small, clear tests than one big ambiguous test that leaves you guessing.
Choose the Right Audience Split
A/B testing works by comparing results between two (or more) groups – so how you split your audience is critical. The ideal split is truly random and evenly distributed, to avoid biasing the test. Most modern tools handle this for you (e.g. your email platform can send Version A to 50% of your list and Version B to the other 50% at random). In digital ad platforms, you might use built-in split testing or run two ad sets each targeting the same audience with different creatives. The goal is to ensure each variant sees comparable audiences under similar conditions. If one batch of emails went out on Monday morning and another on Friday night, results will reflect timing as much as the content. Try to send test variants simultaneously and under equivalent conditions whenever possible.
Smart Promo Codes & Presale Access
Create percentage or flat-rate discount codes with usage limits, date ranges, and ticket type restrictions. Plus unlock codes for private presales.
Also consider sample size – each group needs enough people to produce a reliable result. If your event’s email list is 500 people total, splitting into two groups of 250 may not yield conclusive data (the sample might be too small to reach statistical significance). You might instead use a different approach, like running A one week and B the next (not ideal, but sometimes necessary) or testing on a smaller portion and then rolling out the winner to everyone (more on that in the email section). A/B tests are most powerful at scale, but even modest events can do them by carefully choosing audience splits. The key is fairness and consistency: aside from the test variable, treat both groups exactly the same. That way, any performance gap is due to your change, not an external factor. When in doubt, err on the side of larger test groups and longer test duration to gather enough data – we’ll discuss significance in a moment.
Run Tests Long Enough for Significance
One of the biggest mistakes in testing is declaring a winner too early. Small sample sizes or short test periods can make random noise look like a result. To avoid false conclusions, you need to run the experiment long enough to reach statistical significance – a confidence that the result is real, not chance. How long is enough? That depends on your traffic and conversion rates. As a rule of thumb, aim for at least a few thousand impressions or visitors per variant, or a minimum of 100 conversions on each side, before judging a winner. If one ticket page variation sold 4 tickets and the other sold 6, that difference isn’t statistically significant – it could be luck. In fact, industry data shows fewer than 1 in 7 tests reach statistical significance due to inadequate sample size, a common pitfall noted in A/B testing statistics. Patience is a virtue: let the test run through an entire sales cycle if possible (e.g. across weekday and weekend behavior). Many conversion experts recommend a sample of ~5,000 visitors per version for reliable web test results, which recommends a minimum of 5,000 unique visitors.
Grow Your Events
Leverage referral marketing, social sharing incentives, and audience insights to sell more tickets.
Use built-in calculators or testing tools that indicate significance. For example, email marketing platforms often won’t auto-declare a winning subject line until a certain confidence level (typically 95% confidence) is met. Resist the urge to swoop in after a day because Variant B is “winning” early on – initial leads can reverse themselves as more data comes in. Run the test for a pre-determined period (say, one week or two full send cycles) or until a statistical test says the results are significant. This disciplined approach ensures you don’t swap strategies based on a fluke. It’s also important to avoid “peeking” too often; constantly checking mid-test can tempt you to stop early. Instead, decide on your criteria upfront (e.g. “We’ll collect 1,000 responses each or run for 14 days, whichever comes later”). By running enough data through your experiment, you’ll be able to trust that your winner is truly the better performing option, not just a lucky break.
Leverage the Right Tools (Even on a Budget)
The good news is you don’t need a PhD in statistics or expensive software to run A/B tests. Plenty of user-friendly tools make it straightforward. Email platforms like Mailchimp, Sendinblue, and HubSpot have built-in A/B testing for subject lines and content – you simply input two versions and the system splits the send and reports results. Social ad platforms also offer experimental features: Facebook’s Ads Manager has an Experiments tool for A/B testing ads (or you can manually run two ads and compare), and Google Ads offers campaign experiments to test different strategies. For your event website or ticketing page, there are dedicated A/B testing services (Optimizely, VWO, Google Optimize – though Google Optimize free was sunset in 2023) that let you create page variants and show them to different visitors. If those are out of budget, you can do things like alternating your landing page creative every other day and tracking which version yields more sales – a bit manual, but practically zero-cost.
Don’t overlook your ticketing or marketing platform’s built-in analytics. For example, Ticket Fairy’s platform includes marketing tools and tracking links that let you see which campaigns drive more ticket purchases. Savvy promoters use these features to run “A/B-like” comparisons: e.g. create two tracking links for an event page – one used in Facebook Ads Version A and one in Version B – to measure which ad led to more ticket sales. The same can be done with promo codes (distributing different codes via two influencer partners to gauge who brought in more buyers). These techniques allow testing without special software. The essential point is to measure outcomes: use Google Analytics or your ticketing dashboard to capture metrics like conversion rate, bounce rate, and revenue by source. Many tools have free tiers or trial periods – plenty to run a few experiments for your event. The bottom line: lack of fancy software shouldn’t stop you from testing. Even on a modest budget, you can harness basic tools to get data-driven answers. In the next sections, we’ll explore how to apply these fundamentals across your marketing channels.
Pro Tip: Keep a simple “experiment log” – a spreadsheet or document to track your tests. Record the date, what you tested (e.g. subject line wording), your hypothesis, and the results. This builds an internal knowledge base over time so you and your team learn from each test. It also prevents duplicating experiments or forgetting insights by next year’s event.
Email Marketing A/B Tests: Optimizing Subject Lines, Content & Send Times
Subject Line Showdowns – Boosting Open Rates
In crowded inboxes, the subject line makes or breaks your email’s chance of being opened. That’s why subject lines are one of the most popular and impactful email A/B tests. In fact, 39% of companies worldwide start their email testing with subject lines, with TrueList reporting that 39% of companies start there. To improve your open rates, experiment with different styles of subject text. You can test:
– Urgency/Persuasion: e.g. “Last Chance: Tickets Selling Fast!” vs. a neutral “Upcoming Event Details”
– Personalization: including the recipient’s name or city vs. a generic greeting
– Length and Tone: a short, punchy subject (5-6 words) vs. a longer descriptive one
– Content Teasers: posing a question (“Ready for an unforgettable night?”) vs. making a statement (“Get ready for an unforgettable night.”)
Small nuances can have big effects. For example, one touring festival email had mediocre opens with a generic subject until they tested an urgency-driven line highlighting scarcity. The winning subject, “Don’t Miss Out – 50% of Tickets Gone!”, achieved a 30% higher open rate and led to roughly twice as many ticket sales as the version that simply said “Join Us for an Unforgettable Experience.” The difference was that the winning subject tapped into FOMO and immediacy, whereas the losing one was vague. This real-world test aligns with broader research: marketing studies have found that straightforward, benefit-focused subject lines often outperform “clever” or obscure ones by a wide margin, proving that clarity often beats creativity. In other words, clarity beats creativity when it comes to inbox decisions.
If you’re just starting out, most email platforms make subject line A/B testing easy – you enter two options, choose a portion of your list for the test (say 20% get version A, 20% get B), and after a set period (e.g. 4 hours), the system automatically sends the better-performing subject to the remaining 60%. This way you maximize your open rates for that campaign using the winning subject. Even if you can’t do automatic splits, consider sending one subject to a small segment of your list and another subject to a different segment at the same time, then compare open metrics. Over a few emails, you’ll start to see patterns in what your audience responds to. Do they consistently open mails that mention the artist’s name or a discount? Do emoji or exclamation marks help or hurt? Treat each subject line like a mini-experiment and you’ll steadily lift your open rates – which is the first step to more ticket sales (people can’t buy if they don’t read the email!). And remember, the vast majority of event promoters are doing this – a recent report found over 90% of U.S. companies A/B test their email campaigns, confirming that over 90% of U.S. businesses practice A/B testing. To stay competitive in the inbox, testing is essential.
Content & CTA – What Drives Clicks Inside the Email
Getting the email opened is half the battle; the next challenge is converting that interest into action. A/B testing your email content and design reveals what makes subscribers click the “Buy Tickets” or “RSVP” button inside. There are many elements you can experiment with here:
– Email Copy Length: Try a short, concise message vs. a longer narrative. (E.g. a brief 100-word announcement vs. a story-style 300-word email.) Some audiences prefer a quick hit, while others engage with details – testing will show which yields more clicks.
– Call-to-Action (CTA) Buttons: The wording and design of your buttons are critical. Test text like “Get Tickets Now” vs. “Register Today” vs. “Secure Your Spot”. Also test button color or style (a bright contrasting button may draw more clicks). One promoter found that changing their email CTA text from “More Info” to “Buy Tickets” increased click-through rate, since it set a clearer expectation of the action.
– Images vs. Text: Does your audience respond better to a visually rich email (banner images, artist photos, sponsor logos) or a plain text, personal-feeling message? You can A/B test an image-heavy design against a simpler formatted email. Be mindful to only change the content style, not the offer itself, when doing this test. The results can inform your design strategy: for example, some B2B event marketers discovered plain text emails (that read like a personal note) got higher response rates than polished HTML newsletters.
– Personalization & Dynamic Content: Try inserting personalized content – such as the recipient’s name, their city, or even a reference to a past event they attended – versus a generic version. For instance, “We saw you rocked out at SpringFest last year – ready to do it again?” might be tested against “Get ready for an amazing festival experience!”. Personal touches can boost engagement, but it’s worth testing to ensure it resonates and doesn’t come off as gimmicky.
When running content tests, focus on click-through rate (CTR) and downstream conversions (ticket purchases) as your key metrics. It’s possible one version gets more clicks, but those clicks result in fewer purchases (perhaps because the messaging attracted curiosity seekers who didn’t commit). Always tie back to the ultimate goal: ticket sales. For example, if Version A of your email got a 5% CTR and led to 50 ticket purchases, and Version B got a 6% CTR but only 30 purchases (maybe its messaging attracted less serious clicks), then Version A is actually the more effective content. This is where having good tracking in place is vital – use UTM parameters or unique referral links for each email version to follow the user journey from click to purchase in your analytics. Many event marketers integrate their email with a platform like Ticket Fairy or Google Analytics to see how email traffic converts on the ticket page.
A final tip: test your email layout. If you have a complex email with multiple sections, consider A/B testing a different arrangement or emphasis. For instance, placing the event details at the top vs. below a story, or using a numbered list of lineup highlights vs. a paragraph. One real-world example – an event organizer had an email with two equal CTA buttons (one at top, one at bottom); they tested removing the top button so that readers first absorb info then see a single CTA at the end. Surprisingly, the single-CTA version drove more clicks on the bottom button, likely because readers weren’t distracted by an early ask. These kinds of structural insights can inform all your future emails. The overarching principle: continuously refine your email content through testing, and apply what you learn to your automated sequences, newsletters, and announcements to consistently improve engagement. For more in-depth strategies, consider mastering personalized email campaigns for event promotion – segmentation and automation go hand-in-hand with A/B testing.
Built-In Email Marketing for Events
Send targeted campaigns, automated purchase confirmations, and post-event follow-ups directly from your ticketing dashboard.
Timing Tests – Finding the Sweet Spot to Send
Email marketing isn’t just what you say – it’s when you say it. The timing and frequency of your emails can dramatically impact open and click rates, so these are great candidates for A/B tests or structured experiments. Here’s how you can optimize timing:
– Send Day/Time: Test different days of the week or times of day for your email sends. For example, you might A/B test sending one batch of your list on Tuesday at 10 AM vs. another on Friday at 5 PM to see which gets higher engagement. Many promoters assume “workweek mornings” are best or that “Friday emails get buried.” But your audience might behave differently – only the data will tell. We’ve seen scenarios like a nightlife event finding that emails sent at 8 PM (when target readers are off work and browsing their phones) outperformed 10 AM sends. Conversely, a B2B conference might get better results with early weekday sends. Let the results guide you.
– Frequency and Cadence: If you send regular updates, you can test how often is too often. For instance, split your list into two groups for a month – one group receives a weekly update, the other gets bi-weekly emails – and measure ticket sales or engagement from each. You might discover diminishing returns or unsubscribe increases with higher frequency. On the flip side, not emailing enough can reduce urgency and top-of-mind presence. Finding the right cadence (especially leading up to an event) is something you can refine by testing and monitoring metrics like open rate trends and unsubscribe rates.
– Send Time Personalization: Some advanced email systems allow sending at the recipient’s local time or based on past open habits (if a user always opens emails at night, sending to them at night might boost chance of open). While not a true A/B test since it’s individualized, you could test segmenting your list by timezone or behavior – e.g. Group A gets a morning email, Group B gets an evening email – to see which segment yields better results. This is particularly useful if your audience is spread across time zones globally.
When conducting timing tests, make sure content is held constant. You don’t want to send completely different emails on Tuesday vs. Friday and attribute the difference to timing – ideally send the same email (or as similar as possible) at two different times to truly isolate timing effect. Also consider external factors: avoid comparing a Monday send that had no competition with a Friday send that happened to coincide with a major news event or a social media outage (anything that could skew results). Sometimes you need to repeat a timing test a few times to account for variances.
It’s not always feasible to do pure A/B splits for send times (because you typically send once to your whole list). Many marketers instead do sequential tests: send at one time for one campaign, then try a different time for a similar campaign, and compare performance across those campaigns. Over a series of events or email blasts, you’ll gather directional evidence of which times yield stronger metrics. Be sure to track relevant KPIs beyond opens and clicks too – if a certain send time leads to more purchases per email, that’s your winner even if open rate was a bit lower.
In the run-up to your event, timing tests can help you schedule crucial announcements for maximum impact. For instance, if data shows your ticket purchase emails perform best on Wednesday evenings, you might schedule your final “last tickets remaining” push for a Wednesday 7 PM slot. By contrast, if you find weekend emails for weekend events get traction (peoples’ minds are on weekend plans), you might double down on a Saturday morning promo. The key takeaway is don’t just assume – use testing to truly know when your audience is most responsive. When combined with great content, optimal timing can significantly boost your email-driven ticket sales.
A/B Testing Event Announcements: Lineup Drops and On-Sales
One of the highest-stakes moments for any promoter is the initial launch. A/B testing event announcements—such as phase-one lineup reveals, venue changes, or early-bird ticket drops—can drastically amplify your initial reach. Instead of blasting a single announcement graphic across all channels, savvy organizers test multiple variations of their launch assets. For example, you might test an announcement email that leads with a high-energy hype video against one that features a clean, easy-to-read typographic poster of the lineup. By experimenting with how you break the news to your audience, you can identify which format generates the most immediate shares, tags, and day-one registrations.
Segmentation and Personalization: Tailoring Tests to Audiences
Not all subscribers are the same – and the beauty of A/B testing combined with segmentation is that you can optimize messaging for different groups. In 2026, segmenting your event marketing is more important than ever, so it makes sense to incorporate that into your testing strategy. For example, you might split your list by customer type (first-time attendee vs. loyal VIP, or by age group) and then test different content for each. Perhaps your hypothesis is that new prospects need more basic info about the event (so Version A email includes an “What to Expect” section), whereas past attendees respond better to nostalgia and VIP upgrade offers (so their Version B email mentions “Welcome back, we’ve got something special for you”). After testing, you may find each segment indeed prefers a different style – and you’ve essentially optimized two paths in parallel.
Turn Fans Into Your Marketing Team
Ticket Fairy's built-in referral rewards system incentivizes attendees to share your event, delivering 15-25% sales boosts and 30x ROI vs paid ads.
Segmentation can also be used within an A/B test to eliminate noise. If your list is very diverse, an A/B test on the whole list might produce a muddled average result, when in reality variant A won among one subgroup and variant B won among another. Checking your results by segment can be illuminating. For instance, perhaps an email subject with slang or emojis performed better overall – but when you break it down, it actually hurt open rates with your 40+ age segment while massively boosting opens with 18–24 year-olds. If that’s the case, a sensible move would be to use different subject lines for different demographics moving forward, rather than one-size-fits-all. (Your email platform’s segmentation and conditional content features come in handy here.) The article One Size Doesn’t Fit All: Segmenting Your Event Marketing Strategy provides deeper insight into tailoring messaging by audience – which goes hand in hand with testing.
Keep in mind, when testing multiple segments, treat it like running multiple A/B tests. Each segment should have its own control and variant, and you’ll need adequate sample in each to draw conclusions. It’s also easy to over-segment; don’t slice the pie so thin that no segment has enough audience to test effectively. Focus on meaningful segments (like geography, age bracket, loyalty level, ticket type) where you suspect responses might differ. If you find big differences in test outcomes between segments, you’ve struck gold – you can customize your future marketing for each group to maximize results. Many experienced event marketers use this approach to craft, for example, one subject line that appeals to longtime fans (e.g. “Welcome Back – VIP Offer Inside”) and a different one for new leads (“Discover Your New Favorite Festival”) in separate sends. Both are tested and proven on their respective audiences. The extra effort in segmentation can pay off in significantly higher aggregate conversions.
Finally, remember that personalization itself can be tested. Some audiences love seeing their name or past purchase (“Hey Sarah, ready for another great show?”), while others might not care or could even be put off if it feels too much like a form letter. Try personalizing in one version and not in another and see if it affects your metrics. Advanced personalization, like dynamically featuring content relevant to a user’s location or interests, should also be validated. The guiding principle is test everything, but test methodically – and when you find something that works for a particular sub-audience, double down on it in your targeted campaigns.
Social Media & Ad Campaign A/B Testing: Maximizing Engagement and ROAS
Creative Elements: Images vs. Videos vs. Carousels
On social media and digital ads, creative is king – and it’s often the first thing to test. Different creative formats can yield vastly different results. For example, video content has been exploding in popularity, and it tends to grab attention more effectively than static images for events. One analysis showed that short-form video ads (think TikTok or Reels style clips) can drive 5× higher click-through rates than static image ads in feed, according to analysis on video vs. static ad performance. But before you conclude “always use video,” you should test it with your audience and content. A/B test a compelling image poster for your event against a 15-second highlight video and compare metrics like click-through rate (CTR), engagement (likes/shares), and ultimately ticket conversions. We often see video outperform static for reach and engagement – a well-edited aftermovie or artist teaser can hype fans – but maybe your static flyer with clear info drives more immediate ticket clicks due to its clarity. Only testing can tell.
You can also experiment with formats like carousel ads vs. single image. Carousel ads let users swipe through multiple images or mix of image+video. An A/B test could present a single-image ad (with the headliner’s photo) versus a carousel that includes 3-4 performers or festival attractions. The carousel might engage users to interact (swipe) and see more content, potentially leading to more time spent and higher interest – or it could distract from the main message. Again, test and learn. Pay attention to metrics like CTR per impression and also behavior after the click (did the carousel entice clicks from more qualified leads or just casual swipers?). Many social platforms optimize format delivery automatically (for instance, Facebook will prefer video if it’s getting better results), but as a marketer you should still set up controlled tests to gather learnings that can inform future content creation.
Don’t forget ad placement variations too. On Facebook/Instagram, for example, the same creative might perform differently in Stories vs. Feed vs. Reels. You can A/B test placements by running separate ad sets – one restricted to Stories placement, another to Feed – each with the same creative, to see where it gains traction. Perhaps your vertical videos crush it in Stories but get ignored in the feed. If so, you could allocate more budget to Story ads and design creatives optimized for that vertical, immersive format. The goal is to find the format/placement that best showcases your event and resonates with your audience, then capitalize on it. Testing various creative approaches ensures you’re not leaving a high-performing concept unexplored. Some audiences might scroll past polished graphics but stop for a raw, behind-the-scenes selfie video from the artist – you won’t know until you test static vs. live-feel content. Modern event promotion is as much science as art; use A/B testing to discover the art that most effectively sells your experience.
Grow Your Social Following With Every Sale
Require social media follows, shares, or playlist adds to unlock presale access or special pricing. Turn every ticket purchase into audience growth.
Ad Copy and Messaging Variations
The text accompanying your ads – headlines, descriptions, captions – is another fertile ground for testing. While visuals hook people, the ad copy can convince them to click or purchase by delivering the key info or emotional trigger. Consider A/B testing different messaging angles in your ads:
– Value Proposition: Test what aspect of the event you highlight. For example, “See 10 Bands for $20” (price/value angle) vs. “An Immersive 3-Day Music Adventure” (experience angle). Each might appeal to a different motivation. One might drive more clicks from budget-conscious fans, the other from FOMO-driven thrill seekers.
– Urgency & FOMO: Try incorporating urgency in one ad (“? Limited tickets – don’t wait!”) against a more standard promo (“Tickets on sale now”). We know urgency can spur action, but it’s worth testing how overt to be. Make sure any urgency message is genuine – if it’s early and nothing is actually limited yet, a milder approach might work better to build interest first. One festival found that an ad caption stating “Only 100 Early Birds left!” significantly boosted click-through and immediate sales, compared to a similar ad that just said “Early Bird tickets available” without the quantity cue. If you have real scarcity, test leveraging it.
– Social Proof & Hype: Experiment with including evidence of popularity or excitement. One version could say “Join 5,000+ fans at X Festival” or quote a review (“‘Event of the Year!’ – EDMTimes”), while the other version omits this. Social proof can reassure buyers that this is the place to be. If it’s a new event with no past crowd, you might test messaging like “Be part of an exclusive first-ever event” vs. not mentioning that aspect, to see if exclusivity helps or if it raises concerns.
– Call-to-Action Phrasing: Even the text on your link button (for ads that allow it) or final line can be A/B tested. Facebook, for instance, has preset CTA buttons like “Learn More” vs “Buy Tickets” vs “Sign Up.” Don’t assume – test which CTA language yields the best click-through and conversion rate. “Learn More” might get more clicks from the curious, but “Buy Tickets” might attract those ready to commit (or vice versa!). Finding the right balance can improve your click-to-purchase rate significantly.
When running copy tests, try to keep the creative identical so you’re isolating the message. It can be enlightening to see that sometimes a minor copy tweak (even one word or a different emoji) can move the needle. For example, an event ad that added “??” emoji next to “Tickets” saw a jump in click rate because the symbol caught eyes and reinforced the action. Another campaign tested formal language (“Enjoy an evening of networking and insight”) vs. a more casual tone (“An awesome night of learning and mingling”) for a young professionals event – and found the casual tone got far more engagement, aligning with the target demographic’s style.
Also consider the length of copy. Some platforms like Instagram favor short captions, but on Facebook longer copy can be viewed after a click. Test a concise one-sentence ad text against a longer storytelling paragraph. The latter might pre-qualify more engaged readers, leading to fewer but higher-intent clicks. The former might cast a wider net. Depending on whether you need volume or high conversion, you can adjust your style. The ultimate goal is to identify which messaging drives not just clicks, but ticket conversions. Always look at the funnel: Did that flashy, hype-filled ad copy get lots of clicks but few purchases? Maybe it over-sold or attracted the wrong audience. Meanwhile, the straightforward informative copy might yield a lower CTR but a higher percentage of clickers who buy. By testing and tracking through to ROI (Return on Ad Spend), you can confidently iterate your ad messaging for maximum ticket sales.
One pro technique: use Dynamic Creative Testing on Facebook/Meta. This feature automatically serves various combinations of headlines, texts, and images to find top performers. It’s not a traditional controlled A/B test (since multiple variables mix), but it is a data-driven way to optimize creative elements in bulk. You might input 3 headlines, 3 images, 2 descriptions, and let Facebook figure out the best combo for each user. The platform will favor winners quickly. However, to truly learn which copy works best, you might still follow up with a more controlled A/B test of the winning text vs. a new challenger. Dynamic optimization is great for performance; explicit A/B tests are great for insight. A balanced strategy uses both.
Audience Targeting Experiments
Beyond creative and copy, one of the most powerful levers in digital advertising is who you target. Audience targeting A/B tests can reveal entirely new pools of ticket buyers or save you from overspending on low-converting groups. Here are ways to test and optimize targeting:
– Interest and Demographic Segments: If you’re running Facebook or Instagram ads, you likely start with some assumptions about interests (e.g. fans of certain artists or genres for a music event) and demographics (age, location). Create separate ad sets for different targeting criteria and compare results. For example, one ad set might target “Music Festivals, Coachella, Live Music” interests, while another targets “Nightlife, Clubs, EDM” interests – both promoting the same festival. If you spend $100 on each and see 10 ticket conversions from Set A and only 2 from Set B, you know which targeting is more fertile. Similarly, test age brackets – 18-24 vs 25-34 vs 35-50 – you might discover a surprising segment buying tickets (perhaps an older crowd shows interest in what you thought was a youth event, or vice versa). An actual case study: a promoter for a theater show found that ads targeting a niche local interest (followers of a city historical society) had a conversion rate of 3%, whereas a broad targeting of all adults 18+ in the city converted at only 0.5%. This insight let them shift budget into the high-converting niche and drastically improve overall ROAS, improving overall ROAS through data-driven festival marketing strategies.
– Lookalike vs. Interest Targeting: If you have a past attendee list or strong customer data, test using a lookalike audience (platforms can find people similar to your buyers) against traditional interest targeting. One campaign might rely on a 1% lookalike of last year’s ticket buyers, while another campaign advertises to interest-based audience (say fans of your headline artist). Monitor which yields a lower cost per purchase. Often, lookalikes can outperform because they leverage rich behavioral data – but not always. It’s worth testing because if one clearly beats the other in cost-per-ticket, you can allocate your budget accordingly.
– Geographical Targeting: For events that could draw regionally, test expanding or narrowing your geo-targets. Perhaps you primarily market within a 50-mile radius. You could test ads in an adjacent city or state to gauge interest from farther away, especially if your event is unique or a big festival. Conversely, test focusing budget on the immediate city vs. broadly. Do two small campaigns – one hyper-local, one extended reach – with proportionate budgets and see which drives real sales. We’ve seen festivals uncover entirely new attendee markets by testing ads in cities a short flight away, bringing in ticket buyers they wouldn’t have considered initially.
– Retargeting and Exclusion Tests: Targeting isn’t only about prospecting; it’s also about sequencing. You can test the effectiveness of retargeting campaigns (ads shown to people who already visited your site or engaged) by comparing conversion rates with your cold audience ads. It’s often unsurprising that retargeting ads convert better – those people have shown interest – but the test here is more about budget allocation. For instance, if your retargeting ads have a cost per acquisition (CPA) of $5/ticket versus $20/ticket on cold audiences, you might re-balance spend to maximize that retargeting pool first. Additionally, test excluding certain groups from your targeting. If you run a general ad but suspect a lot of budget is wasted on, say, very young teens who can’t attend, try an A/B where one ad set excludes ages under 18 and compare results. If performance improves (and it likely will if those clicks were not converting), you’ve learned to refine your targeting criteria.
The objective of audience testing is to find where your marketing dollars yield the best returns. In ad terms, you’re looking for high relevance audiences that convert at a low cost. A/B testing audiences requires keeping creative constant while varying who sees it. If you notice one audience variant consistently outperforms, it’s time to pivot your strategy to emphasize that segment. Sometimes this leads to strategic shifts – for example, discovering a new demographic is really into your event might prompt you to tweak event programming or messaging to cater to them. Or you might find that your assumption of who the core audience is was slightly off, and testing helped correct course.
Full Pixel & Analytics Integration
Install Meta Pixel with Conversions API, Google Analytics, TikTok Pixel, Reddit Pixel, and Spotify Pixel on your event pages. Server-side tracking for accurate attribution.
One caution: ensure sufficient budget and time for each audience test cell. If you split your budget too thin across many audiences at once, you may not get a clear read (each might only get a few clicks or none, which isn’t informative). It can be more effective to test two audiences at a time, identify a winner, then challenge it with a new audience in the next round, and so on. Over the course of a campaign, this evolutionary A/B testing will hone in on the best audience. Many top event advertisers follow a playbook: start broad, test multiple audiences, quickly pause poor performers, double down on the best – then iterate new variations to beat the champion. By event day, your ads are hitting exactly the right people, thanks to the data you gathered.
Budget and Bid Strategy Experiments
Optimizing your ROI sometimes comes down to how you spend, not just where. A/B testing different budget allocations and bid strategies can further improve your paid marketing results:
– Budget Split Tests: If you’re using multiple channels (say Facebook vs. TikTok ads, or ads vs. boosted posts), try allocating more budget to one versus the other for a period and compare outcomes. For example, allocate 70% of your spend to Facebook/Instagram and 30% to TikTok for two weeks, then flip it to 30/70 for the next two weeks, while monitoring ticket sales from each. This isn’t a classic simultaneous A/B, but a sequential test that can reveal the point of diminishing returns. You may find that beyond a certain spend, one channel’s cost per acquisition rises sharply, meaning the other channel gives better marginal returns for additional budget. The result might be a more efficient overall budget mix (e.g. 60/40 split is optimal rather than 90/10).
– Bidding Strategies: Many ad platforms let you choose bidding strategies – like optimizing for link clicks vs. conversions, or setting a target cost per result vs. letting the platform auto-bid. These are worth experimenting with. As an example, you could run two campaigns on Facebook: one using the default “Lowest Cost” bid (let Facebook spend to get the most conversions), and another using a “Cost Cap” bid where you tell it the maximum you’re willing to pay per purchase (say $20 per ticket buyer). If the cost cap campaign still spends and gets you purchases under that cap, great – you’ve controlled costs. If it struggles to spend or brings in fewer conversions, that tells you the cap might be set too low versus reality. Likewise, testing “Landing Page Views” optimization versus “Purchase” optimization can sometimes be insightful if your pixel hasn’t gathered enough purchase data yet – the former might get more people to the site whereas the latter tries to get fewer but more qualified clicks. Always measure the bottom line though: sometimes a campaign with fewer clicks but higher purchase intent (due to better optimization) will yield more ticket sales.
– Ad Frequency and Duration: Budget tests can include how long to run ads before creative fatigue. You can A/B test showing an ad continuously vs. pulsing it. For instance, run Version A ads every day, while Version B ads you deliberately “darken” every few days or lower budget to see if scarcity boosts performance when they reappear. Some event marketers find that rotating multiple creatives (to keep content fresh) outperforms hammering the same ad for 4 weeks – that’s more of a creative burnout test, but it’s tied to budget pacing too. Monitoring frequency (average number of times each person sees your ad) is key. If one group saw it 5 times and another only 2 times on average, different results could be due to ad fatigue. Testing different budget paces (spend fast vs. slow burn) can inform whether you should concentrate spend in short bursts around key announcements or spread it evenly.
These types of tests intersect with overall campaign strategy and might be more advanced, but they are invaluable for maximizing return on ad spend (ROAS). For example, by testing, you might learn that bidding for conversions optimizes for a cheaper cost per sale even if it means a higher cost per click – a tradeoff you’d gladly take. Or you may find that beyond $500 a day on Instagram, your cost per result shoots up, whereas TikTok still delivers efficiently up to $1000/day; thus you’d scale TikTok more. Treat each campaign as an opportunity to fine-tune these parameters. Keep notes on what budget levels and tactics yield the best outcomes for future reference.
When diversifying your media mix, applying X ads budget testing best practices in 2026 is highly recommended for event organizers. X (formerly Twitter) has refined its ad delivery algorithms, making it crucial to test daily budget caps against lifetime budgets for short-window event promotions. A best practice is to allocate a small, controlled test budget to X during your initial lineup announcement, comparing engagement rates and cost-per-click against your Meta campaigns before scaling spend.
It’s worth noting that some platforms (like Google Ads) encourage automated bidding and budget optimizations that adjust themselves. Those can work well, but as a data-driven marketer, you should still run your own tests to verify you’re getting the best bang for your buck. In summary, test and measure not just creative and audiences, but also how you deploy your spend. The ultimate measure of success is selling more tickets for less money – by systematically experimenting, you can uncover the optimal strategy to achieve that.
When evaluating these bid strategies, it helps to compare your results against industry standards. While costs fluctuate by genre and region, understanding Facebook ads cost per signup benchmarks for 2026 event registration gives you a baseline for your experiments. If the current benchmark for a B2B conference registration or festival pre-sale signup hovers around $4 to $8 per lead, and your winning ad variant brings that down to $3, you know your creative testing is highly effective. Use these benchmarks as a yardstick to determine if your ad experiments are truly outperforming the market average.
A/B Testing Ideas by Channel: The table below summarizes common elements you can experiment with across your marketing channels:
Channel / Platform Examples of A/B Test Variables Email Marketing Subject line text and style; Sender name (brand vs. person); Email content length; CTA button text or color; Personalization vs. generic copy; Send day/time Social Media Ads (Meta, TikTok) Image vs. Video vs. Carousel formats; Short caption vs. long caption; Different ad headlines; Utilizing urgency or promo code in one version; Target Audience A vs. B (interest or lookalike); Platform placements (Stories vs. Feed) Website/Landing Page Headline message (e.g. focus on lineup vs. experience); Banner media (static image vs. video background); Placement of key info (schedule, map, etc.); CTA button text (“Buy Tickets” vs. “Register Now”) and color; Showing a countdown timer or stock counter vs. none; Including attendee testimonials vs. no social proof Ticket Offers & Pricing Presenting an early-bird discount vs. standard pricing (to a small segment); Single ticket vs. bundle package emphasis; Payment plan option shown vs. hidden; “Fees included” vs. “+ fees” messaging clarity SMS/Text Campaigns Message phrasing (urgent alert vs. friendly reminder); Including event name or just RSVP link; Sending at different times of day; Using a custom short URL vs. full link (to gauge trust and click tendency) Influencer Promotions Different promo codes or tracking links per influencer (to compare sales each drives); Gifting one influencer VIP access vs. another just free tickets to test content quantity/quality; Testing content style – influencer A’s takeover story vs. influencer B’s static post for reach and conversion This is not exhaustive, but it shows how any channel can be optimized. The bold idea: treat every marketing activity as an experiment, and you’ll continually uncover ways to boost performance.
Landing Pages & Ticketing Sites: A/B Testing Your Conversion Funnel
First Impressions: Event Landing Page Design
By the time a potential attendee lands on your event page, you’ve won half the battle – now you need to convert that interest into an actual ticket purchase. A/B testing your landing page design and content is crucial for turning clicks into confirmed attendees. Start with the basics: test your headline and hero section. This is the first thing visitors see. Does a clear, descriptive headline (“Electronic Music Festival in London – July 2026”) work better, or a hype-driven tagline (“London’s Can’t-Miss Electric Wonderland”)? Try both and measure which leads to more add-to-cart actions. Also experiment with your hero media: a high-energy highlight video vs. a striking static image. For example, a tech conference might test a banner image of a keynote crowd against a short looping video of last year’s highlights. One might engage visitors longer and convey the vibe better, resulting in higher sign-ups.
The page layout can also be optimized. You can A/B test the arrangement of information – version A might put the schedule and lineup up top, whereas version B leads with an engaging story or value propositions (“Why You’ll Love This Event”) before getting into details. Different audiences prefer different approaches; casual visitors might need an enticing pitch first, while die-hard fans just want to see the lineup immediately. Make sure your test measures the end goal (ticket purchase or registration conversion) to judge which layout actually sells more tickets. Sometimes a beautiful, content-rich page can ironically distract users from clicking the “Buy” button (information overload), whereas a more streamlined page drives a quicker decision.
Another key element: navigation and length. Do you have a long-scroll page with all details, or do you tuck content under tabs or accordions? You could test a “long-form single page” design versus a “compact page with FAQs hidden under expanders.” See which format keeps users engaged and moving to checkout. Keep an eye on metrics like bounce rate and time on page in addition to conversion rate – if one design drastically lowers bounce (meaning more people stick around), that’s a good sign, provided those people then convert at a decent rate. We’ve observed scenarios where simplifying an event page (removing extra sections, cutting copy fluff) improved conversion by 10-15%, presumably by focusing visitors on the core info and call-to-action. In other cases, adding a prominent video or photo gallery to showcase the experience increased conversion – likely because it built excitement and trust. Every event is different, so it pays to test these assumptions on your own audience.
Calls-to-Action & Ticket Purchase Flow
The ultimate goal on your site is to get the visitor to click that “Buy Tickets” or “Register” button and complete the checkout. Optimizing this funnel via testing can yield substantial ticket lift. Start with the call-to-action (CTA) button itself. Test variations in the text: common options include “Buy Tickets”, “Get Tickets Now”, “Register Now”, “RSVP Today”, etc. A subtle wording change can influence user psychology. For instance, “Get Tickets Now” might imply urgency, whereas “Register Now” might sound more like signing up (some users could worry it’s more steps). One venue found that changing their CTA from “Reserve Now” to “Buy Tickets” clarified the action and increased click-throughs by 8%. Color and design matter too – a bright contrasting color that stands out from your page vs. a more subdued color that matches your theme. If your page design currently has a low-contrast CTA (like a white button on a light background), try a bold color and see if click rates improve. The placement of the CTA is another factor: test having the primary CTA near the top vs. only at bottom or both. Generally, having a sticky buy button or multiple CTAs (after key sections) can catch users whenever they’re convinced and ready to act.
Beyond the button, consider the ticket selection and checkout process. These may be partially dictated by your ticketing platform, but there are still elements to optimize. If you have the ability to A/B test your purchase flow or at least analyze drop-off, do it. For example, test a one-page checkout versus multi-step (if your platform allows a simplified version). Or even something small like the default ticket quantity set to 1 vs. 0. If one variant makes it slightly easier or faster for users, it can reduce abandonment. Many e-commerce studies show fewer steps = higher conversion, though for events you often need to capture specific info. Some event organizers have found success in testing the information fields: for instance, making “Phone Number” optional instead of required and seeing if that reduces form abandonment. If you’re noticing a big drop-off at a certain step (like account creation or payment info), experiment with messaging on that step. Perhaps one version offers a “Continue as Guest” option and another doesn’t, to measure if forcing account signup hurts conversion (spoiler: it usually does). A/B tests in the checkout should be approached carefully (you don’t want to break the flow), but even small messaging differences like adding a trust indicator or money-back guarantee text can be tested. For instance, adding “Secure Payment” or “Tickets 100% guaranteed” near the checkout button might reassure some buyers to complete. See if including such trust signals in one variant improves completion rate.
On event pages, urgency and scarcity tactics are common – and very testable. If your ticketing system allows, you might display a running low inventory count (“Only 20 tickets left at this price!”) or a countdown until a price increase. It’s well documented that clear scarcity messaging can spur faster purchases. A/B test showing a scarcity widget vs. hiding it. According to industry experts, conversion rates are much higher for event pages that incorporate genuine countdowns or “limited seats” notices, leveraging the power of FOMO to drive sales. Platinumlist, a ticketing service, noted significantly greater conversion when countdown timers and low-ticket warnings were present because they create a sense of now-or-never urgency. In your test, ensure that any urgency message is truthful – and watch the impact. If conversions jump when users see “Only 2 VIP passes left!” then you know that tactic works on your audience (no surprise – FOMO is powerful). Just be ethical: don’t fabricate scarcity, as that can backfire if people sense it’s fake. For ethical best practices on using these tactics, see our guide on using urgency and FOMO ethically in event marketing. The idea is to test driving urgency in the UI vs. a neutral approach – you’ll likely find at least moderate gains in conversion with the right use of countdowns, limited quantities, or early-bird deadlines.
Let’s not forget mobile vs. desktop design. In 2026, a large portion (if not majority) of your traffic is probably on mobile devices. You should test your page experience on mobile carefully. For instance, maybe your default design is desktop-first and on mobile the buy button or key info is pushed way down – you could test a mobile-optimized layout where the CTA is one of the first things a user sees on their phone. If your platform permits separate mobile adjustments or if you have a responsive design that you can tweak, treat mobile optimization as its own testing ground. Sometimes something as simple as reducing page load time (via image compression or removing a heavy background video on mobile) can be A/B tested server-side, and it might increase conversion on mobile dramatically by not losing impatient users. Keep an eye on your analytics: if you see, say, mobile visitors have half the conversion rate of desktop, that’s a red flag to test solutions – perhaps a simplified page for mobile, larger text, different aspect ratio images, etc.
In summary, optimize every step from landing to checkout with iterative tests. Event marketers who obsess over their conversion funnel often achieve big payoffs. For instance, by testing and tweaking, an event organizer might improve their landing page-to-ticket conversion rate from 3% to 5% – that’s a huge increase in ticket sales, effectively squeezing more revenue out of the same traffic. Below is an example table of A/B test results for various page tweaks, showing how small changes can impact conversion:
Example A/B Test Outcomes – Landing Page & Checkout Optimization
(Illustrative results from event campaigns)
Test Element Version A (Control) Version B (Variation) Outcome (Winner & Uplift) Headline text “Experience the Ultimate Food Fest” “Taste 50+ Dishes at Food Fest 2026” B had higher engagement – Winner, +9% page click-through to tickets Hero media Photo of crowd 10-sec highlight video loop A slightly higher conversion – Winner, +5% purchases (video distracted some users) CTA Button Color Matches site theme (orange) Contrasting color (bright green) B noticeable improvement – Winner, +12% click rate on CTA CTA Placement Only at bottom of page Sticky bar “Buy Tickets” on scroll B significantly better – Winner, +18% more starts to checkout “Tickets Left” Indicator No stock information “Only 30 tickets left at this price!” text B drove urgency – Winner, +15% purchase conversion rate Checkout field requirement Phone Number required Phone Number optional B reduced friction – Winner, checkout completion +6% Note: Results will vary by event; what works for one audience might differ for another. Always rely on your own A/B tests to guide decisions.
Building Trust Through Testing
A often overlooked aspect of conversion is trust and credibility. If users feel any uncertainty about your event or the purchasing process, they hesitate. A/B testing can help identify ways to build trust. Consider testing the inclusion of trust badges or guarantees: for example, “Official Event Organizer” seal, SSL secure checkout badges, refund policy statements, etc. Version A might be a clean page, Version B includes a small “Tickets backed by a 100% refund guarantee if event is canceled” note. See if Version B alleviates concerns and improves conversions (especially for new events or audiences that don’t know your brand). Similarly, showcasing reviews or attendee testimonials can be tested – one version of your landing page could include a quote from last year’s attendee (“Best New Year’s party I’ve ever attended!”) and a star rating visual, whereas another version has no social proof. If the version with testimonials nudges more people to buy, you’ve gained a powerful insight: that social proof is key for your crowd.
Another trust factor is consistency of information. Make sure the messaging from your ad or email carries through to the landing page. If your ad promised “50% off until Friday”, but the landing page doesn’t clearly mention that sale, users might get confused or lose trust. You can run an A/B test where Version A of the page is generic, and Version B reiterates the offer from the ad at the top (“Save 50% when you book by Friday!”). This can reassure users they’re in the right place and the offer is valid, potentially boosting conversion. If you see a lift with the consistent messaging version, it’s a sign to always align your pre-click and post-click messages closely.
Lastly, don’t be afraid to test post-conversion upsells or surveys for learning (though this veers into post-purchase, it can still inform marketing). Some organizers, for instance, test adding a “How did you hear about us?” question after purchase (with a small incentive to answer). While not an A/B test in the strict sense, it can yield data to cross-verify which channel brought them – which in turn refines your marketing focus (and can validate your A/B test findings on audiences). You could A/B test whether adding such a survey affects completion rate of purchases – if it does negatively, you might remove it; if not, it’s free data.
In summary, your event’s website and ticketing page is a goldmine of optimization opportunities. By methodically testing headlines, media, CTAs, form fields, content sections, and trust elements, you steadily lower the friction for interested visitors to become ticket buyers. Combined with the tactics from earlier (getting more of the right people to your site via tested emails and ads), you’ll be converting a higher percentage of visitors – meaning more tickets sold without needing more traffic. A true win-win.
Interpreting A/B Test Results: Metrics, Significance, and Next Steps
Metrics That Matter: Decoding Your Data
Running A/B tests is half the work – understanding the results is the other half. It’s crucial to track the right metrics for each experiment and to interpret them correctly. Here’s a quick reference of key metrics and what they tell you:
| Metric | What It Measures | Why It’s Important in A/B Testing |
|---|---|---|
| Open Rate (email) | % of recipients who opened an email | Indicates subject line effectiveness (did it grab attention?). Use for email subject tests. Higher open rate can lead to more conversions if content delivers. |
| Click-Through Rate (CTR) | % of audience who clicked a link (in email or ad or page) | Shows engagement and interest. For ads, a higher CTR often means your creative/copy is resonating. In emails, CTR reveals content/offer attractiveness beyond the subject line. Compare CTR alongside conversion rate to ensure clicks are quality. |
| Conversion Rate | % of users who completed the desired action (purchase, sign-up) out of total who engaged (clicked or visited page) | The ultimate measure of success for most tests. Did Variant A vs. B actually produce more ticket sales or registrations? A variant might win on clicks but if it doesn’t convert, the real winner is the one with higher conversion to sale. |
| Cost Per Acquisition (CPA) (ads) | Ad spend divided by number of conversions (tickets sold) | Critical for paid media tests – tells you how efficiently each variant turns dollars into buyers. A lower CPA variant is preferable even if raw numbers (clicks, etc.) are lower. Use this to evaluate ad audience or messaging tests in terms of ROI. |
| Return on Ad Spend (ROAS) | Revenue generated per dollar of ad spend (often expressed as a ratio or %) | A big-picture metric to judge an ad variant’s profitability. If Ad Version A yields $5 revenue per $1 spent (500% ROAS) and Version B yields $3 per $1, A is the winner financially. Particularly useful when testing different channels or campaign strategies. |
| Bounce Rate (landing page) | % of visitors who leave immediately without interacting | Signals if a page variant might be off-putting or irrelevant. If Variant B has a much lower bounce rate than A, it means it’s capturing attention better initially. Always consider bounce alongside conversion (a low bounce is good only if those extra people eventually convert). |
| Time on Page / Engagement Time | How long users spend on a page (or video watch duration, etc.) | Provides context to qualitative differences: e.g., a variant with a video might have longer time on page. Good if it means higher interest, but if not paired with conversion it could indicate distraction. Use in content tests to gauge interest depth. |
| Sign-Up or Add-to-Cart Rate | Intermediate conversion steps (e.g. % clicking “Buy” who then add to cart or start checkout) | Helps pinpoint where in funnel differences occur. Maybe both page variants get equal CTR on “Buy Tickets”, but one has higher drop-off during checkout – that clues you in that differences in later steps (like form complexity) might be at play. |
When analyzing an A/B test, focus on the metric aligned to your primary goal. If you were testing email subject lines, open rate and ultimately ticket purchases from that email are key. If testing landing pages, conversion rate (to purchase) is king. It’s easy to get lost in vanity metrics (“Variant A got more likes!”), but always tie back to what drives ticket sales or event success.
Importantly, look at the full funnel impact. For instance, in an ad test: Ad A had a 1.0% CTR and Ad B a 0.7% CTR. At first glance, Ad A seems better at engaging users. But if those clicks from A converted to sales at only 2%, and B’s clicks converted at 5%, then the math may favor B in actual ticket sold per impression. You’d calculate actual conversion per impression or overall CPA to be sure. This scenario isn’t uncommon: sometimes an approach that yields fewer but more qualified prospects is superior. So, whenever possible, track the end-to-end journey in your analytics – from impression or send, to click, to purchase. That’s where having a solid attribution setup (using UTM tags, unique coupon codes, or integrated tracking with your ticketing platform) pays off. In the modern era of privacy, attribution can be hazy, but using first-party data and tools as outlined in how event marketers measure success without cookies will help you tie A/B results to ticket sales as much as possible.
Was It Significant? Understanding Test Reliability
Once you have the metrics, you need to determine if the difference between A and B is statistically significant or just a random blip. Statistical significance is a way of saying we’re confident the observed difference wasn’t due to chance. Many A/B testing tools will give you a confidence level (e.g., “95% confidence Variant B is better”). If you’re doing it manually, you might use an online A/B significance calculator. As a rule, aim for at least 95% confidence to call a result a true winner. If a test comes back 80% or 90% confidence, there’s still a notable chance the difference could have occurred by luck – in these cases, savvy marketers often say the test is inconclusive and either run it longer or try a refined experiment.
Aside from significance, consider the practical significance. If Variant B’s conversion rate is 0.1% higher than A, and it’s statistically significant, is that lift worth acting on? For a huge site like Amazon, 0.1% could be millions of dollars; for a one-time event selling 1,000 tickets, 0.1% is just 1 more ticket. So always weigh the magnitude of change. Often, you’re looking for big wins (5%, 10%, 20% improvements) from your tests. Those happen, but sometimes small gains can accumulate too. Use your judgment on which changes are worth implementing, especially if a variant that “wins” by a hair would be costly or complex to roll out.
If a test is inconclusive or a flat tie, that’s not a failure – it tells you that particular change didn’t impact things much. You’ve learned something: perhaps that both versions are equally acceptable, so you might default to whichever is easier to implement or align with branding. Or it means the area you tested isn’t a key factor, and you should focus elsewhere. Don’t be disheartened by null results; in fact, about 80% of A/B tests in general may not achieve a significant positive lift, considering that only 1 out of 8 tests typically yields significant wins (especially as companies get more optimized over time). The wins you do get make it all worthwhile, and even the “losses” and “ties” guide your next steps.
A crucial part of interpreting results is also checking for errors or biases. Ask yourself: did something abnormal happen during the test period? For example, if you were A/B testing on-sale launch strategies and Variant B coincided with a website outage for a few hours, its results might be unfairly low. In such cases, you might invalidate the test or rerun it. Also, ensure you didn’t accidentally skew the split – e.g., sometimes we discover one email variant went to a segment of more loyal customers by chance, and of course it did better. That’s why using proper randomization and large sample sizes helps, but always sanity-check the outcome. If something seems off (Variant B had far fewer impressions, etc.), investigate your test setup.
Another tip: look at segment breakdowns of results. Suppose overall there was no clear winner, but when you break down by new vs. returning users, you see a big difference – that insight is valuable. Your next test could target that segment with a tailored approach. Many testing tools allow you to slice results by device, browser, demographic (if known), etc. Use that to detect if maybe “Variant A wins on desktop, B wins on mobile” – then you might choose different experiences for each platform rather than one-size-fits-all.
In summary, interpreting results is about combining statistical rigor with business context. You use stats to confirm it’s a real effect, and context to decide what it means and what to do next. When you find a statistically significant improvement, celebrate it and implement it! If the result is negative (Variant B performed worse), that’s also useful – it saved you from a bad change and educated you about your audience’s preferences. Always document these learnings.
Avoiding Pitfalls: Common A/B Testing Mistakes
While A/B testing is powerful, there are a few traps to avoid when drawing conclusions:
– Stopping the test too early: As mentioned, calling a winner after seeing initial favorable numbers is risky. This often leads to “false wins” that don’t hold up. Avoid peeking and ending tests before reaching a solid sample size or duration.
– Testing too many variables at once: If you change 3 things and see improvement, you might credit the wrong thing. Multivariate tests have their place but require very high traffic. Most events should stick to one change at a time. If you must test combinations (e.g. two very different marketing strategies), know that you’ll get a result for that combo but won’t know which elements were key.
– Chasing vanity metrics: It’s easy to get excited about an increase in clicks or time on site, but make sure those translate to ticket sales or core goals. A variant that yields more page views but no extra purchases isn’t truly better for business. Always align with your primary KPIs (Key Performance Indicators).
– Not considering external factors: If your A variant runs during a week where a competitor event is announced, and B runs when there’s no news, results could be skewed by external context. Try to test simultaneously under like conditions. When interpreting, note anything that could have influenced behavior unrelated to your test change.
– Overreacting to one test: Each test is a data point, not a prophecy. If results are surprising or counter-intuitive, replicate them if possible. Sometimes one odd cohort or random variance can slip through. If a very risky or expensive change is indicated by a test, consider running it again for confirmation before fully committing, as a safeguard.
The good news is that by being methodical and patient, these pitfalls are entirely avoidable. Seasoned campaign veterans recommend setting up a testing roadmap so you’re not ad-hoc testing whatever but rather systematically improving critical elements. That way you’re less likely to test insignificant things or misread results.
One more thing: learn from failures. Not every campaign will be a hit, and not every test will improve metrics. Perhaps you ran a big promotion A vs. B and neither drove the urgency you hoped for, and the event underperformed until a last-minute rush. Analyze what might have gone wrong. Did you misidentify your audience? Did you rely on a tactic (like a vague teaser campaign) that didn’t connect? Case studies of event marketing failures (see five real-world event promotion flops and lessons learned) often show that skipping testing and ignoring data leads to trouble. For instance, assuming an edgy ad campaign would resonate without testing it on a sample audience can result in poor ticket sales, as shown in A/B testing case studies for effective experimentation. Use your A/B results, even the negative ones, to course-correct. If all your early promotions aren’t moving the needle, pivot your strategy – that’s the whole point of an agile, test-informed approach.
Furthermore, rigorous experimentation is one of the best diagnostic tools when campaigns underperform. If you are analyzing low ticket sales reasons in 2026, your past split-test data can reveal whether the issue stems from poor ad creative, a high-friction checkout process, or simply a mismatch in audience targeting. Rather than guessing why a show isn’t selling, promoters can look at their historical metrics to pinpoint exactly where the conversion funnel is breaking down and deploy targeted fixes.
Iterate and Scale: From Insights to Sold-Out Events
The end of one test is usually the beginning of the next. Once you identify a winner in an A/B test, implement that change fully, but don’t stop there. Treat it as your new baseline (the new “control” to beat). The culture of optimization is continuous. For example, if a particular ad copy significantly outperformed others, roll it out as your main campaign message. Then perhaps introduce a new variant to challenge it after some time (a champion-challenger model). Over time, your marketing assets become more and more refined, like a sword being repeatedly sharpened.
It’s also important to scale up what works. If you discover through testing that TikTok ads are bringing in younger attendees at a high ROI, and your Facebook ads are lagging, you might reallocate budget and effort toward TikTok heavily for this event (and maybe future ones). If an email with a certain format gets double the usual response, consider adopting that format for all your newsletters. Essentially, leverage your wins across all applicable areas. This is how data-driven marketing leads to sold-out shows – by amplifying successful tactics and dropping duds quickly.
Keep your team and stakeholders in the loop. Share clear results of A/B tests (a simple report or slide with “Variant A vs Variant B – A delivered 25% higher conversion, so we’ll be using A’s approach going forward”). This not only builds confidence in marketing, but it also cultivates a testing culture beyond just marketing channels. You might inspire event operations or customer service teams to experiment and improve their processes too (e.g. testing different survey incentives for feedback, etc.).
Finally, as the event passes and you move into post-event analysis, review all the tests you ran and their outcomes. Did your iterative improvements correlate with reaching ticket goals? Often, you’ll find that a series of small 5-10% lifts from various tests added up to a much stronger overall campaign performance. Maybe you wouldn’t have sold out without that combination of a better targeting strategy, a more compelling email series, an optimized landing page, and so on – all results of your many experiments. This is the real power of data-driven marketing: each insight compounds. And even if an event didn’t sell out, you have a treasure trove of learnings to carry into your next event’s marketing plan.
In essence, interpreting A/B test results isn’t just about crunching numbers – it’s about closing the feedback loop. Use data to learn who your audience truly is, what they want, and how they behave. Then craft your future strategies around those truths. Marketers who do this conscientiously often find they can replicate success more reliably, because they’re not just throwing darts in the dark – they’ve mapped the target through testing.
A/B Testing on Any Budget: Big Impact with Small Experiments
High-Impact Testing When Resources Are Tight
You might be thinking, “This is great for large events with big budgets and teams, but I only have a few thousand dollars (or less) to spend on marketing – can I really do A/B testing?” The answer is yes, absolutely. Even on a shoestring budget or with a small audience, you can employ the same principles in a scrappy, smart way. The key is to prioritize high-impact, low-cost tests. Focus on changes that are easy to execute and likely to yield noticeable results. For example, testing different social media content is essentially free – you can post two styles of content and see which gets more engagement, then invest your energy in the type that works. Testing an email subject costs nothing but a bit of time to write two versions. These “cheap” tests can still lead to more tickets sold with no extra ad spend.
When budget is limited, start with organic channels and owned media for experimentation. Your social posts, email list, event listing page – optimize those first. It makes any paid advertising you do that much more efficient. For instance, if through organic testing you learn that highlighting the headliner artist consistently gets more response than talking about the venue amenities, you can apply that messaging to your flyers and any ads you eventually run. Similarly, if one particular Instagram Reel about your event goes semi-viral (maybe the one where you included attendee testimonials) and another flops (just a generic flyer), that’s a directional A/B test – lean into the type of content that sparked interest when you then boost posts or create ad content.
Another approach is leveraging free or trial tools. Many email services offer A/B testing even on lower-tier plans (or you can do it manually by splitting your list). Social platforms don’t charge extra for creating multiple posts or ads to test – you pay for the reach, but you decide how to split campaigns. Google Analytics (free) can help you analyze user behavior on two different landing page variants (you might alternate them by day if you can’t run a true simultaneous A/B without paid tools). Also, consider using qualitative feedback as a proxy when quantitative is hard – for example, run a Twitter poll or Instagram poll asking which of two event taglines people find more exciting. It’s not perfectly scientific, but it’s quick insight from real potential attendees. The scrappiest promoters find ways to validate ideas without spending a dime, then put their limited dollars behind the proven concept.
One high-impact area to test on low budget is offers and pricing tactics. You may not be able to afford two completely separate ad campaigns, but you can test offering a small incentive vs. not offering one by targeting two groups in your existing network. For instance, send one segment of past attendees a loyalty promo code (like “TAKE5” for $5 off) and see if their purchase rate exceeds a segment that got the same email without a code. If the promo code significantly boosts conversions, you’ve learned that a modest discount could pay for itself in volume – insight you can use when you plan your spending. If it doesn’t matter, you saved yourself from issuing unnecessary discounts across the board. These kinds of controlled “trial runs” on a small scale help ensure that when you roll out a tactic widely, it’s effective.
Low-Cost Channels and Grassroots Testing
When funds are minimal, grassroots marketing and creative tactics become your best friends – and you can apply A/B testing to them too. For example, community posters or flyers: let’s say you print two versions of your flyer for an upcoming club night – one highlights the DJ’s image, another highlights drink specials and pricing. Distribute Flyer A in neighborhood X and Flyer B in neighborhood Y (ideally similar demographically) and use unique QR codes or simple URLs to track responses (like flyerA.myevent.com vs flyerB.myevent.com). This way you can actually gauge which design/offer pulled more interest. It’s old-school A/B testing but it works! If one flyer yields significantly more ticket scans or website visits, you know which messaging to double down on in your remaining promo efforts. Street teams can also help – instruct half your team to pitch the event using one talking point, and half using another, then have them report which seemed to get more enthusiastic reactions or sign-ups. It’s qualitative, yes, but over many interactions a pattern will emerge.
Another low-cost channel: influencer and referral marketing. If you can’t invest heavily in paid ads, you might rely on partners or word-of-mouth. You can structure simple tests here too. Give two micro-influencers slightly different briefs and track whose unique referral link generates more ticket sales. Or encourage two different referral messages among your fan base (“Bring a friend and both get a perk” vs. “Share this 10% discount with your friends”) and see which referral code gets used more. This helps identify the most motivating offers for your advocate network. Sometimes the results are surprising – you might find people prefer a small free merch item for referrals over a cash discount, for instance. Knowing that allows you to focus your limited resources on the incentive that actually moves the needle.
Social media is a free playground for creative testing. Use features like Instagram Stories polls, Twitter AB votes, or even alternating your event page’s content. For a grassroots example: suppose you run a Facebook Event page – you could change the cover photo one week (Variant A) and observe RSVP growth or engagement that week, then change to an alternate cover photo the next week (Variant B) and compare. Or post two different TikTok videos highlighting different aspects of your festival (one focusing on music, another on food and art) and see which gets more shares or comments indicating interest. The beauty is the cost is just your time. When budget is low, time and creativity are your currency – and testing ensures you’re spending that time on the right things.
One caution for low-budget testing: don’t spread yourself too thin. If you only have 100 website visitors a day or a 1,000 person email list, you can’t test a dozen variants and expect clear insights. Focus on the big questions first – the ones that, if answered, could really boost your sales. Maybe it’s “Which headliner should we emphasize in marketing?” or “Is highlighting the early-bird deadline effective?” or “Which local community is more likely to come, X or Y?” Choose tests that align with these strategic uncertainties. It’s better to get a solid read on a few crucial things than to try a lot of tiny tests that don’t gather enough data each to be reliable. If your numbers are small, consider longer test durations or combining data from multiple similar events (if you run a series of small events, treat them as repeated tests to bolster sample size). For example, if you do monthly club nights, you could alternate two promo strategies each month and after 4-5 events see which strategy tended to result in higher attendance across multiple trials.
Maximizing Value from Each Test
When every dollar counts, you want each experiment to be as informative as possible. Here are some tips to maximize value:
– Test radical differences initially: Big changes are more likely to yield big results (which are easier to measure with limited data). Instead of tweaking button color first, test a completely different message or creative style. If one approach flops, you know to eliminate it. If it shines, you’ve found a direction to follow. Once you hone in on a good strategy, then you can do smaller optimizations. For example, test a video ad vs. a static ad before you worry about the perfect tagline on the video.
– Use free analytics everywhere: Set up Google Analytics (or similar) on your website/ticket page, and use the data. Track conversions, referral sources, and user behavior. Even if you can’t afford fancy attribution software, a lot can be done with UTM parameters in URLs and Google’s free tools. For instance, tag your social posts links with utm_source=InstagramA vs InstagramB for different content and watch GA to see which yields more goal completions. The insight is free.
– Learn from others and reuse ideas: With a tight budget, you might not be able to test every creative idea you can think of. Save time by learning from similar events or industry benchmarks. For example, if you read a case study on how a particular email subject format yielded higher opens for a conference, use that as one of your test variants. Low-budget event marketing guides often contain tricks that worked for others – you can test those directly rather than starting from scratch. It’s like standing on the shoulders of giants, cheaply.
– Pool your resources: If you’re promoting multiple small events (say a weekly club night), treat them as a series to test and improve. What you learn in week 1’s promotion, apply in week 2 with a tweak, and so on. Over time, you’ll spend the same modest amount but with increasing efficiency as your message gets refined through ongoing mini-experiments. Even collaborating with other small event organizers to share generalized results (if non-competing) can help – e.g. knowing that another promoter saw success posting at a certain time or using a certain venue photo could inform your decisions without you having to test it from zero.
Finally, remember that creativity and authenticity can outperform money in engagement. A heartfelt personal invite video from the organizer might go further than a polished ad, and it costs nothing to make with a smartphone. You can test authentic content vs. polished content cheaply and often the authentic wins for events because fans appreciate real connection. When you find something that resonates emotionally with your audience, that’s a win no matter the budget. Testing simply helps you find those resonance points faster and with evidence.
Even modest-scale event marketers have achieved sell-outs by rigorously optimizing their limited spend. For instance, a local indie concert series might only spend £500 on Facebook Ads, but by A/B testing targeting and content in small batches, they ensure those £500 reach the right fans and convert them, whereas a competitor might blow £1000 on a generic campaign and see lackluster results. In that sense, testing is the ultimate force multiplier for a small budget – it lets you do more with less by investing your efforts where they have the most impact.
Real-World A/B Testing Wins: Case Studies and Lessons
Case Study 1: The One-Word CTA That Boosted Ticket Sales 20%
Sometimes a tiny copy change can make a huge difference. We mentioned earlier the example of Aarhus Teater in Denmark, which provides a textbook case. The theater’s website originally had a single ticket purchase button labeled “Køb Billet” (Danish for “Buy Ticket”). They hypothesized that many visitors came intending to buy multiple tickets (for a couple or group), and that the singular phrasing might subtly deter adding more than one seat. So they tested changing the text to “Køb Billetter” (“Buy Tickets”). Everything else on the page stayed identical. The result? A 20% increase in online ticket revenue after implementing the plural “Tickets” wording, documented in a case study on successful A/B test experiments. This suggests the new button made it clearer that users could purchase for their group in one go, or simply resonated better by implying a more inclusive purchase. It’s astonishing that one word – literally adding an “s” – had such impact, but it underscores the importance of aligning with user intent. The lesson: always put yourself in the attendee’s shoes and test finer details of your calls-to-action. If a minor copy tweak better matches how your audience thinks (e.g. “tickets” instead of “ticket”), it can remove friction and boost conversion significantly. After the test, Aarhus Teater permanently adopted the improved CTA, contributing to fuller houses and happier patrons who found it easier to complete their desired action.
Case Study 2: Urgent Subject Line Doubles Email Conversions
A live music festival in New Zealand was promoting a limited early-bird sale for a 10,000-capacity event. They decided to run an A/B test on the email announcement’s subject line to maximize the impact of the early-bird urgency. Version A had a straightforward subject mentioning the festival and dates: “Rhythm & Vines 2026 – Early Bird Tickets On Sale Now”. Version B took a more urgent tone: “? Early Birds 50% Sold Out – Don’t Miss Rhythm & Vines!”. The content of the email was identical, highlighting the discounted price deadline. The results were dramatic – the urgency-laden subject (Version B) achieved about a 28% higher open rate than the simple one. More importantly, the click-throughs and conversions from that email were nearly double for Version B. The explicit mention that “50% sold out” (which was true at the time) and the emotive “Don’t Miss” FOMO trigger spurred many subscribers to act immediately, fearing they’d lose the deal. In contrast, Version A’s more neutral announcement, while informative, didn’t convey any urgency – those who opened it still bought tickets, but far fewer felt compelled to click through right now. This case demonstrates how crafting your messaging to tap into the psychology of urgency (ethically, of course) can significantly boost outcomes. The festival organizers noted that without that test, they might not have realized just how much the phrasing could affect sales – and they might have left a lot of early revenue on the table. Armed with this insight, they’ve since made urgency and FOMO a standard element to test and deploy in all time-sensitive communications.
Case Study 3: Finding a New Audience Goldmine through Ad Testing
A conference in the tech startup space was struggling to scale registrations via social ads. Initially, they targeted obvious interests like “startup founder, venture capital, tech events” on Facebook and LinkedIn, but the costs per sign-up were high. The marketing team decided to A/B test some less obvious audience segments based on an insight: many founders are active in personal development and life hacking communities. They launched a test on Facebook with one ad set targeting the standard business interests (control) and another targeting interests such as “Tim Ferriss, Productivity, Mindfulness, Personal Growth” – basically, interest signals of optimization-oriented individuals who might also be entrepreneurs. Much to their surprise, the second segment outperformed. The cost per ticket sale was 40% lower in the personal growth interest group than the business interest group. Why? It turns out this “latent” audience included many startup founders and professionals who weren’t self-identifying via Facebook as “startup” interest, but were reachable through their broader interests. The ads themselves were identical; only the targeting differed, so the team quickly realized they had discovered an untapped pool of buyers. They immediately reallocated budget to this new audience and even tailored some messaging in the ads to speak more about personal growth benefits of the conference (e.g. “Level up your startup and yourself”). Registrations surged, and the campaign ROI improved markedly. The lesson here is to challenge assumptions about who your audience is and where they lurk. By experimenting with varied targeting – even a hunch based on anecdotal persona insight – you might find a rich vein of interest that your competitors or past campaigns missed. One successful test can literally change your entire marketing strategy and open up new attendee demographics. Post-event surveys of this conference confirmed a noticeable chunk of attendees learned about it through those non-traditional interest ads, validating the power of that one A/B test.
Case Study 4: When a Marketing Miss Fires – The Cost of Not Testing
A large New Year’s Eve music festival in Europe learned a hard lesson in 2025 about assuming you know your audience. The organizers poured a huge budget into a slick promotional video as the centerpiece of their campaign – a cryptic, conceptual film that teased the festival theme without showing any artists or crowd shots. It was beautifully produced and they blasted it out via YouTube ads and socials. However, ticket sales started sluggishly. About two weeks into the campaign, they were far behind previous years’ pace. In a scramble, they polled some loyal fans and combed comments, finding that people didn’t “get” the promo video – it lacked the energy and clear info festival-goers wanted (lineup, location vibe, etc.). The team quickly pivoted to release a standard highlight reel from past years featuring big crowds and artist cameos – essentially the kind of content they could have tested initially. Once that went live, engagement and sales picked up, but they had lost precious time (and budget). In retrospect, a simple A/B test could have prevented this misstep. They could have trialed the conceptual ad vs. a more traditional hype reel on a smaller scale (e.g. with a subset of their ad budget or on one platform first) and measured which drove more ticket site visits or early conversions. The data would likely have shown early on that the cryptic approach wasn’t resonating, allowing them to adjust before committing the entire budget. This failure, while painful, reinforced the importance of testing creative approaches. The festival’s marketing director later instituted a policy that no major creative concept goes live without a test – whether via a focus group, a small-scale online A/B, or at least a social media poll. The takeaway for other event marketers: no matter how cool or groundbreaking you think your new marketing idea is, let the audience vote with their clicks and wallets. It’s much better to have a modest pilot fail and learn from it than to have a big launch flop because nobody challenged the concept with real-world feedback.
Each of these case studies – from huge wins to cautionary tales – highlights a core truth of event marketing: data-driven experimentation is key to unlocking growth and avoiding costly mistakes. When you test and learn, you’re effectively letting your attendees guide you to the best marketing decisions. It’s a more humble approach (acknowledging we don’t always know best) but it’s incredibly powerful in practice. The more you integrate A/B testing into your campaigns, the more of these success stories you’ll be able to tell about your own events.
Frequently Asked Questions About Event A/B Testing
How should promoters approach A/B testing event announcements?
When launching a new festival or revealing a lineup, organizers should test different creative formats (like hype videos versus static typographic posters) and messaging angles (focusing on the experience versus the headliners) to a small segment of their audience first. This ensures the primary announcement maximizes shares and day-one ticket sales.
What are the common reasons for low ticket sales in 2026, and how can testing help?
Common culprits include ad fatigue, high-friction checkout flows, and misaligned audience targeting. By running continuous split tests on your landing pages and ad sets, you can diagnose exactly where potential attendees are dropping off and optimize those touchpoints to recover lost revenue.
What are the Facebook ads cost per signup benchmarks for 2026 event registration?
While costs vary by genre and location, the Facebook ads cost per signup benchmarks for 2026 event registration typically range between $4 and $8 for B2B conferences and festival pre-sales. Promoters should use these figures as a baseline when A/B testing ad creatives, aiming to optimize campaigns until their cost per acquisition falls below the industry average.